eupolicy.social is one of the many independent Mastodon servers you can use to participate in the fediverse.
This Mastodon server is a friendly and respectful discussion space for people working in areas related to EU policy. When you request to create an account, please tell us something about you.

Server stats:

205
active users

#fluiddynamics

1 post1 participant0 posts today

A Braided River

The Yarlung Zangbo River winds through Tibet as the world’s highest-altitude major river. Parts of it cut through a canyon deeper than 6,000 meters (three times the depth of the Grand Canyon). And other parts, like this section, are braided, with waterways that shift rapidly from season to season. The swift changes in a braided river’s sandbars come from large amounts of sediment eroded from steep mountains upstream. As that sediment sweeps downstream, some will deposit, which narrows channels and can increase their scouring. The river’s shape quickly becomes a complicated battle between sediment, flow speed, and slope. (Image credit: M. Garrison; animation credit: R. Walter; via NASA Earth Observatory)

Aboard a Hurricane Hunter

For decades, NOAA has relied on two WP-3D Orion aircraft–nicknamed Kermit and Miss Piggy–to carry crews into the heart of hurricanes, collecting data all the while. Every ride aboard a Hurricane Hunter is a bumpy one, but some flights are notorious for the level of turbulence they see. In a recent analysis, researchers used flight data since 2004 (as well as a couple of infamous historic flights) to determine a “bumpiness index” that people aboard each flight would experience, based on the plane’s accelerations and changes in acceleration (i.e., jerk).

The analysis confirmed that a 1989 flight into Hurricane Hugo was the bumpiest of all-time, followed by a 2022 flight into Hurricane Ian, which was notable for its side-to-side (rather than up-and-down) motions. Overall, they found that the most turbulent flights occurred in strong storms that would weaken in the next 12 hours, and that the bumpiest spot in a hurricane was on the inner edge of the eyewall. That especially turbulent region, they found, is associated with a large gradient in radar reflectivity, which could help future Hurricane Hunter pilots avoid such dangers. (Image credit: NOAA; research credit: J. Wadler et al.; via Eos)

Thawing Out

Lake Erie, the shallowest of the Great Lakes, can almost completely freeze over in winter. In this satellite image of the lake in March 2025, about a third of the lake remains ice-covered, while sediment — resuspended by wind and currents — and phytoplankton swirl in the ice-free zone. In recent decades, scientists discovered that diatoms, one of the phytoplankton groups found in the lake, can live within and just below Erie’s ice, thanks to a symbiotic relationship with an ice-loving bacteria. This symbiosis allows the diatoms to attach to the underside of the ice and gather the light needed for photosynthesis. Even in the depths of winter, an ice-covered lake can teem with life. (Image credit: M. Garrison; via NASA Earth Observatory)

Earth’s Core is Leaking

In Earth’s primordial days, liquid iron fell through the ball of magma that was our planet, collecting elements–like ruthenium-100–that are attracted to iron. All of that material ended up in Earth’s outer core, a dense sea of liquid metal that geoscientists assumed was unable to cross into the lighter mantle. But recent observations suggest instead that core material is making its way to the surface.

Measurements from volcanic rocks in the Galapagos Islands, Hawai’i, and Canada’s Baffin Island all contain ruthenium isotopes associated with that primordial core material, indicating that that magma came from the core, not the mantle. Separately, seismic analyses suggest that this material could be crossing through continent-sized blobs of warm, large-grained crystals caught deep below Africa and the Pacific, at the boundary between the mantle and the outer core. For more, check out this Quanta Magazine article. (Image credit: B. Andersen; research credit: N. Messling et al. and S. Talavera-Soza et al.; via Quanta)

Double Detonation in Type 1a Supernovae

Type 1a supernovae are agreed to be explosions of white dwarf stars, the remains of stars similar in mass to our Sun. They’re thought to be triggered when extra mass — from a nearby companion star, for example — triggers a runaway fusion reaction in their carbon and oxygen, elements that white dwarfs generally don’t have enough mass to successfully fuse. The runaway fusion then blows the star apart.

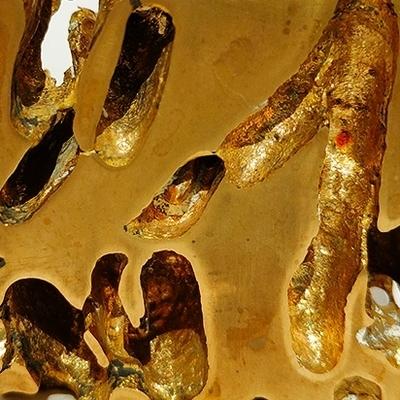
But there’s another theory — demonstrated through numerical simulations — that suggests an alternate mechanism: a small explosion on the star’s surface could compress the interior enough to trigger fusion of the heavier elements there, thereby triggering a second detonation. The two explosions would happen in quick succession, making them difficult to detect, but astronomers predicted that each explosion could create a shell of calcium; given enough time, those two shells could drift apart, allowing astronomers to see a shell of sulfur between them.

The team looked to a supernova remnant about 300 years old, and using a spectrograph from the Very Large Telescope, they were able to image — as predicted — a two shells of calcium, separated by sulfur, supporting the double-detonation hypothesis.

The impact of double-detonation in Type 1a supernovae could be far-reaching. Right now, the intensity of these objects seems to be consistent enough that astronomers use their brightness to estimate their distance. Over the years, those distance estimates have been used to measure the universe’s expansion and provide evidence for the existence of dark matter. But if Type 1a supernovae are not all the same intensity, we may need to reevaluate their use as a universal yardstick. (Image credit: ESO/P. Das et al.; research credit: P. Das et al.; via Ars Technica)

Studying Hydroelastic Turbulence

Can energy at the small-scales of a turbulent flow work its way up to larger scales? That’s a question at the heart of today’s study. Here, researchers are studying hydroelastic waves — created by stretching a thin elastic membrane over a water tank. The membrane gets vibrated up and down in just one location with an amplitude of about 1 millimeter. The resulting waves depend both on the movement of the water and the elasticity of the membrane, mimicking situations like ice-covered seas.

Rather than simply dying away, the local fluctuations introduced at the membrane spread, coalescing into larger-scale hydroelastic waves. How energy flows between these scales could have implications for weather forecasting, climate modeling, and other turbulent systems. (Image and research credit: M. Vernet and E. Falcon; via APS)

Roll Waves in Debris Flows

When a fluid flows downslope, small disturbances in the underlying surface can trigger roll waves, seen above. Rather than moving downstream at the normal wave speed, roll waves surge forward — much like a shock wave — and gobble up every wave in their way.

Such roll waves are fairly innocuous when flowing down a drainage ditch but far more problematic in the muddy debris flows of a landslide. Debris flows are harder to predict, too, thanks to their combined ingredients of water, small grains, and large debris.

A new numerical model has shed some light on such debris flows, after showing good agreement with a documented landslide in Switzerland. The model suggests that roll waves get triggered in muddy flows at a higher flow speed than in a dry granular flow but a lower flow speed than is needed in pure water.

For a great overview of roll waves, complete with videos, check out this post by Mirjam Glessner. (Image credit: M. Malaska; research credit: X. Meng et al.; see also M. Glessmer; via APS)

Veil Nebula

These glowing wisps are the visible remains of a star that went supernova about 7,000 years ago. Today the supernova remnant is known as the Veil Nebula and is visible only through telescopes. In the image, red marks hydrogen gas and blue marks oxygen. First carried by shock waves, these remains of a former star now serve as seed material for other stars and planetary systems to form. (Image credit: A. Alharbi; via APOD)

Glacier Timelines

Over the past 150 years, Switzerland’s glaciers have retreated up the alpine slopes, eaten away by warming temperatures induced by industrialization. But such changes can be difficult for people to visualize, so artist Fabian Oefner set out to make these changes more comprehensible. These photographs — showing the Rhone and Trift glaciers — are the result. Oefner took the glacial extent records dating back into the 1800s and programmed them into a drone. Lit by LED, the drone flew each year’s profile over the mountainside, with Oefner capturing the path through long-exposure photography. When all the paths are combined, viewers can see the glacier’s history written on its very slopes. The effect is, fittingly, ghost-like. We see a glimpse of the glacier as it was, laid over its current remains. (Image credit: F. Oefner; video credit: Google Arts and Culture)

https://www.youtube.com/watch?v=_EJrCXGQuFg

Searching for the Seiche

On 16 September 2023, seismometers around the world began ringing, registering a signal that — for 9 days — wobbled back and forth every 92 seconds. A second, similar signal appeared a month later, lasting about a week. Researchers tracked the signal’s origin to a remote fjord in East Greenland, where it appeared a glacier front had collapsed. The falling rocks and ice triggered a long-lasting wave — a seiche — that rang back and forth through the fjord for days.

Simulations showed that a seiche was plausible from a rockfall like the two that caused the seismic signal, but, without first-hand observations, no one could be certain. Now a new study has looked at satellite data to confirm the seiche. Researchers found that the then-new Surface Water and Ocean Topography (SWOT) satellite and its high-resolution altimeters had passed over the fjord multiple during the two landslide events. And, sure enough, the satellite captured data showing the water surface in the fjord rising and falling as the seiche ricocheted back and forth.

It’s a great reminder that having multiple instrument types monitoring the Earth gives us far better data than any singular one. Without both seismometers and the satellite, it’s unlikely that scientists could have truly confirmed a seiche that no one saw firsthand. (Image credit: S. Rysgaard; research credit: T. Monahan et al.; via Eos)

A Sprite From Orbit

A sprite, also known as a red sprite, is an upper-atmospheric electrical discharge sometimes seen from thunderstorms. Unlike lightning, sprites discharge upward from the storm toward the ionosphere. This particular one was captured by an astronaut aboard the International Space Station. That’s a pretty incredible feat because sprites typically only last a millisecond or so. The first one wasn’t photographed until 1989. (Image credit: NASA; via P. Byrne)

See the Solar Wind

After a solar prominence erupts, strong solar winds flow outward from the sun, carrying energetic particles that can disrupt satellites and trigger auroras if they make their way toward us. In this video, an instrument onboard the ESA/NASA’s Solar Orbiter captures the solar wind in the aftermath of such an eruption. The features seen here extended 3 solar radii and lasted for hours. The measurements give astrophysicists their best view yet of this post-eruption relaxation period, and the authors report that their measurements are remarkably similar to results of recent magnetohydrodynamics simulations, suggesting that those simulations are accurately capturing solar physics. (Video and image credit: ESA; research credit: P. Romano et al.; via Gizmodo)

A Variety of Vortices

Winds parted around the Kuril Islands and left behind a string of vortices in this satellite image from April 2025. This pattern of alternating vortices is known as a von Karman vortex street. The varying directions of the vortex streets show that winds across the islands ranged from southeasterly to southerly. Notice also that the size of the island dictates the size of the vortices. Larger islands create larger vortices, and smaller islands have smaller and more frequent vortices. (Image credit: M. Garrison; via NASA Earth Observatory)

Dancing Metal Droplets

Droplets of a gallium alloy are liquid at room temperature. When spiked with aluminum grains and immersed in a solution of NaOH, the droplets change shape and move in a random fashion. This video delves into the phenomenon, describing how a chemical reaction with the aluminum grains changes the local surface tension and creates Marangoni flows that make the droplets move. To get the droplet motion, you need to have the aluminum concentration just right. With too little, there’s not enough Marangoni flow. With too much, the hydrogen gas produced in the chemical reaction disrupts the droplet motion. (Video and image credit: N. Kim)

https://www.youtube.com/watch?v=XYRj0Ty9udo